Song Diagrams
£3.50
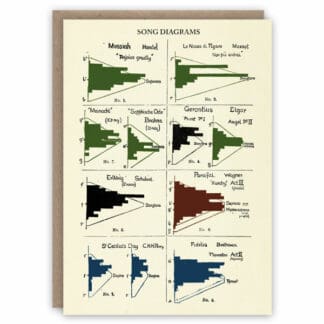
‘Song diagrams’ adapted from The Voice, An Introduction to Practical Phonology, WA Aikin (1910). The vertical axis shows the range of a given voice type (soprano, contralto etc.), while the horizontal bars plot the prevalence of each note (C, D, E etc.) sung in a given composition. In this way the diagrams attempt to show which pieces of music require a lot of high notes and might, consequently, strain the singer.
Compostable wrapper.
Printed with vegetable-based inks on a carbon neutral press using responsibly sourced, acid free Italian paper.
170mm x 120mm.
Blank inside.
Individually wrapped in a compostable bag, with a 120gsm recycled kraft envelope.
In stock


